This is how the ‘annual tax statement’ SHOULD have appeared!
We all owe a debt of thanks to Richard Murphy, over at Tax Research UK. He has broken down the information in George Osborne’s misleading ‘annual tax statement’ into its component parts and then put a new version together, under categories that more accurately describe the spending concerned.
Then he turned the information into a handy pie chart – similar to Osborne’s but with one major change:
This version is accurate.
Here it is:

Let’s just compare it with Osborne’s…
Big difference!
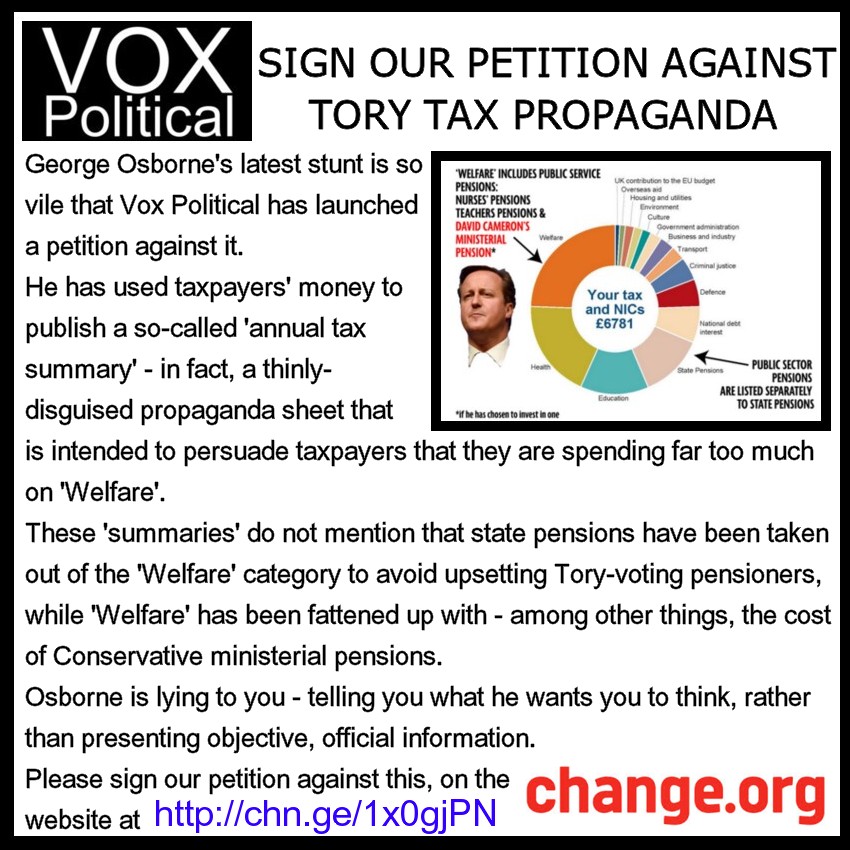
The most interesting to Vox Political is the perception gap between Mr Murphy’s calculation of the total proportion of tax spent on unemployment benefits – 0.67 per cent – and Osborne’s ‘Welfare’ heading, which constitutes 24 per cent of spending.
Talk to most people about ‘Welfare’ and they’ll think you mean unemployment benefits – so the Osborne chart will make them think that government spending on the unemployed is no less than 36 times as much as is in fact the case.
When a government minister exaggerates the facts by that much, he might as well come out and admit that he’s lying to the people.
Mr Murphy wrote: “This is the statement George Osborne would not want you to see because it makes clear that subsidies, allowances and reliefs extend right across the UK economy. And they do not, by any means, appear to go to those who necessarily need them most. The view he has presented on this issue has been partial, to say the least, and frankly deeply misleading at best.”
He wrote: “Add together the cost of subsidies to banks, the subsidy to pensions and the subsidy to savings (call them together the subsidy to the City of London) and they cost £103.4bn a year – more than the cost of education in the UK.
“It’s also no wonder house prices are so distorted when the implicit tax subsidy for home ownership is £12.6 billion a year.”
He also pointed out that unemployment benefits cost only half the amount used to subsidise personal savings and investments.
For full details of Mr Murphy’s calculations, visit his article on the Tax Research UK site.
Mr Murphy tweeted yesterday: “Almost every commentator now agrees that Osborne is going to spend a fortune sending out tax statements that are wrong. Why not cancel now?”
He won’t unless he’s forced to; he has a political agenda to follow.
That is why Vox Political launched a petition to achieve just that.
If you haven’t already, please visit the petition on the Change.org website, sign it, and share it with your friends.
While you’re at it, feel free to share the infographic, created to support the petition:
Please also read yesterday’s Vox Political article on Osborne’s ‘annual tax summaries’, if you haven’t already.
Follow me on Twitter: @MidWalesMike
Join the Vox Political Facebook page.
Vox Political needs your help!
If you want to support this site
(but don’t want to give your money to advertisers)
you can make a one-off donation here:

Buy Vox Political books so we can continue
bringing you the facts as we find them!
Health Warning: Government! is now available
in either print or eBook format here:


The first collection, Strong Words and Hard Times,
is still available in either print or eBook format here:


Shadow government sleeping on the job again, surely not.
Just wait until they realise the PFI &PPP figures are not included in the National Debt.
Don’t panic Mr Mainwaring.
An excellent pie chart – everyone please share it far and wide!
Can the opposition, TUC or anyone put this on at least one bill board in every main town & city, and newspaper ads, as this is too good an opportunity to “out” their whole raft of lies and mis-use of public funds for their own gain?
they are masters at fooling the nation and giving out false figures. its only
due to people like yourselves that we are finding out about the misleading information they are producing. i just hope that enough people are taking note. and will vote accordingly (and i dont mean vote UKIP they are even worse if thats possible). i have never known a more deceitful government
Not sure – but everyone shares it amongst their friends on social media and the like it could easily reach 24 million taxpayers!
I would want it to be in the faces of people we possibly couldn’t reach, mocking their own gullibility for voting for this shower of liars and perhaps the only true information they may see, if they use the Daily Fail or the BBC for their news.
Why do we need to Subsidise Banks 4.21% of our Tax Revenue ? ~ Can’t someone/Party suggest we redistribute that into other more deserving areas to avoid more Austerity! ~ Just an idea! :D (Y)
Curious as to why in the correct pie chart ‘agriculture’ appears twice? Could someone explain please? #confused
So it does – under ‘Industry, Agriculture and Employment’ and then in its own right as ‘Agriculture’. I’ll ask.
Thank you.
I’ve had a reply from Mr Murphy, who apologises and says it should have been removed from the combined heading when it was given a heading of its own.
Ah okay.
So Osbourne is sticking to his agenda, to paint a disasterous picture of what happens when people don’t take responsibility if they rely too heavily on the state to fund their lifestyle. You are sticking to yours by not taking responsibility for the 12 years of the last Labour government. Two ends of the same stick, let’s have some middle ground, some balance without agenda!
I criticise Labour where it’s necessary – which means that, in suggesting otherwise, you must have an agenda too.
Mike, does anyone know where, in this “tax spend” summary, payments to the private companies running WCAs and Workfare programmes are listed? I’d imagine it would be under “specific non-unemployment benefits” or “Industry, agriculture and employment” in Richard’s chart.
I don’t; I’ll ask.
Tax reliefs and VAT exemptions included. So basically, propagating the view that money is the state’s first and foremost, unless it decides to ‘write us a cheque’. Wrongo!
What, Richard Murphy’s reassessment propagates that view, or Osborne’s piece of tat?
I’m not sure what you’re saying here.
I’m saying that tax reliefs and VAT exemptions have no place on that graphic.
It’s not money the government has spent (which is the point of the statements, to show people where their cash goes), it is money the government has chosen not to collect. It belongs to the individuals who have earnt it.
Oh really?
I wonder what other readers think.
Well it’s not about what other readers think, surely? It’s about what the government spends taxpayers’ money on.
It’s disingenuous to include reliefs and exemptions and the motive behind it is political, which is what you’re accusing Osborne of.
The point is, I think, that reliefs and exemptions show where the government expects taxpayers to support other individuals who – by rights – should be making a contribution on their own behalf. Your suggestion that this is their money to keep is inaccurate. It belongs in the Treasury but this government has decided to subsidise these people instead.
Other readers are likely to be able to provide more expert opinions.
How does being offered a tax relief equate to being supported by other taxpayers? It just means you get to keep more of your own money!
Your statement ‘it belongs to the Treasury’ is exactly what I was getting at with my first comment. The government could not exist without private wealth creation. It does not ‘own’ anything in its own right, it takes its money from us after we earn it.
I’d be interested to know whether you think that VAT not levied on children’s clothing or essential foodstuffs, for example, ‘belongs to the Treasury’?
The clue is in the phrase: “tax relief“. That means the government is letting somebody off paying the tax that they owe. They’re not keeping their own money – they’re keeping the State’s.
VAT isn’t levied on children’s clothing. That means it isn’t taxed. That’s a very different thing from tax relief.
As for your views on private wealth creation, ask yourself this: Who actually makes money – the pound coins, 50p pieces, £5 or £50 notes that circulate in the UK economy? Do you really think we make it? Of course not. Banks make it. Specifically, the Bank of England mints the coins and prints the bills, and the government charges us taxes that must be paid using that currency in order to validate it. Read this: http://alittleecon.wordpress.com/2014/06/03/the-basics-of-modern-monetary-theory/
Parliament is actually having a debate on who creates money later this month. It will be interesting to see where the Tories think it comes from, since they seem intent on removing it from the UK economy as much as possible.
Richard Murphy, who created the chart, points out: “They are technically called tax spends… The impact of a tax spend is identical to government spending because in both cases the person [benefiting] ends up with more in their pockets as a result of a deliberate government decision. They are, therefore, directly comparable.”
No, tax relief is relief from the burden of tax for the individual in question.
And no, VAT isn’t levied on children’s clothing. It is, therefore, a VAT exemption (they’re also included in the graphic). So I’ll ask you again, does that money belong to the state?
I obviously wasn’t talking about the creation of money, I’m very familiar with our disgusting system of fractional reserve banking. When I spoke of wealth creation, I was talking about businesses that generate a profit through trade and the individual salaries that are paid as a result. You know, the ones the government can’t function at all without.
You are mistaken. You need to understand what you’re discussing before you can expect to be taken seriously.
And with all due respect, Richard Murphy is talking nonsense.
Tax relief is the OPPOSITE of a tax spend. Talk about double-speak.
Well – with all due respect – unless you’re one of the six people in the world who were more influential than him on the subject of global tax in 2013, or someone who has superceded him in that respect since, I’ll continue to accept his word over yours.
In the second paragraph after the pie charts, you say Osborne’s figure is out by a factor of 16. I assume you got this by comparing the figures of 24% and 0.67% from the previous paragraph. If that’s the case, then by my arithmetic it should be a factor of about 36, even more of a distortion.
You’re absolutely right – I multiplied 24 by 2/3, like an idiot, when I should have multiplied it by 1 1/2. I’ve amended it.